Author: Dwayo Team

  • Working with VS Code Dev Containers and Git

    One of the challenges developers face is to manage requirements of different projects while keeping their local environment functional. VS Code Dev Containers is a perfect solution to this challenge moreover, using VS Code Dev Containers, a developer can work with many different versions of libraries for different projects. While the local environment remains protected against configurations bummers and security threats that come with experimenting with untrusted code. In this blog we will see how to rightly setup VS Code Dev Containers to manage your code properly with git.

    You are at the right place if you encountered: Please make sure you have the correct access rights and the repository exists. If you see this error while trying to push from visual studio code remote container. This article explains how to add existing code in a container to a remote repository.

    Setting-up repos for existing code / experiments that started in vs dev containers

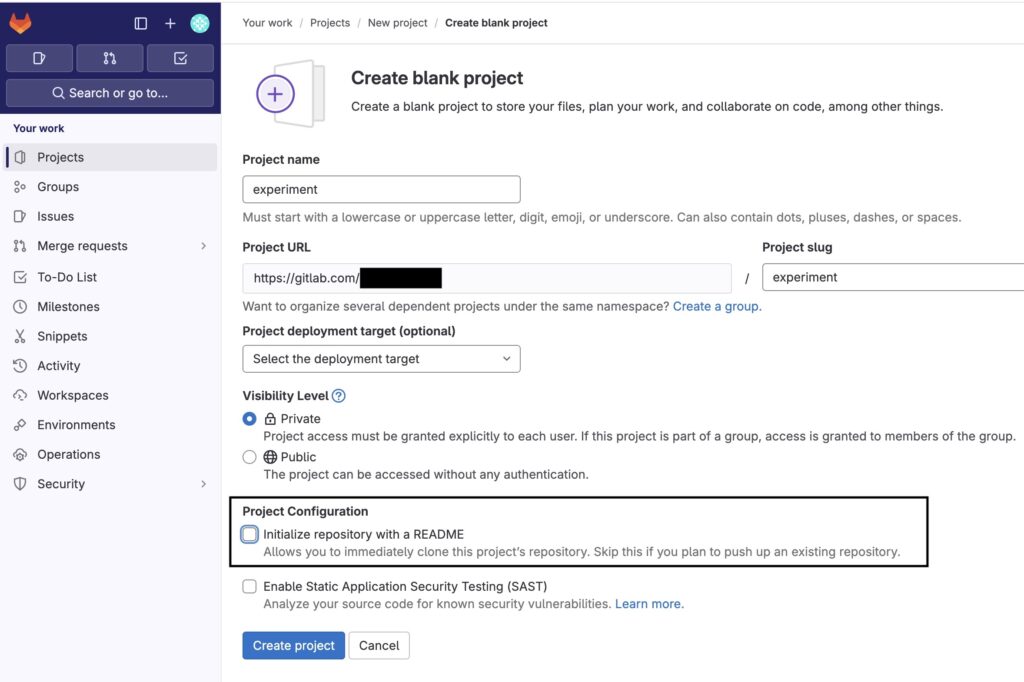
    1. Create a new repo on your hosting service, in this example, we will use Gitlab but instructions would remain the same for any other service.
    2. Don’t include a README.md as shown in the image
    1. In the VS Code Dev container, open a terminal and set git globals
    git config --global user.name "Your Name"
    git config --global user.email "[email protected]"
    1. Assuming, you are in the project directory in dev container, initialize git repo
    git init --initial-branch=main
    git remote add origin https://gitlab.com/xxxxxxxxx/experiment.git

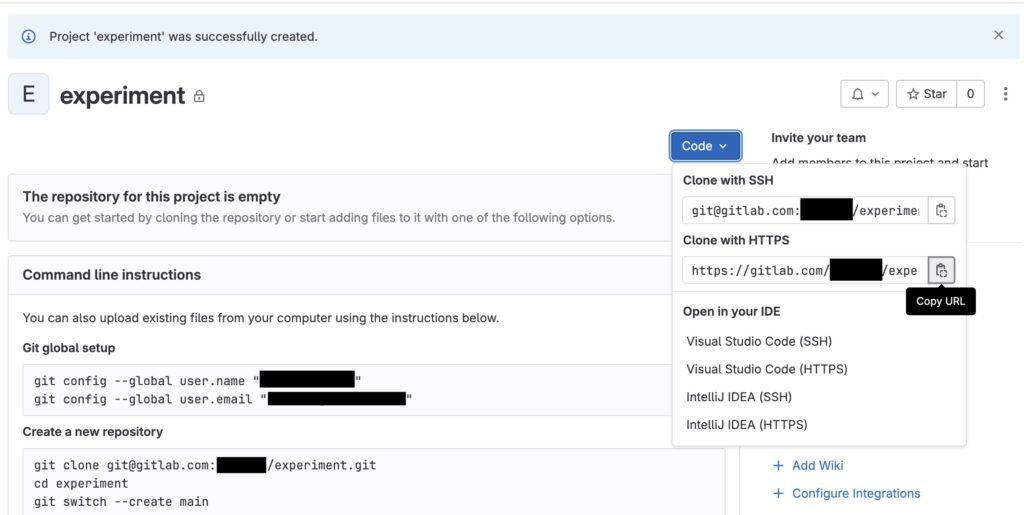
    Notice, the highlighted text where we are using https address of the repo and not using ssh version. This is important to allow VS Code credentials helper to work and you not having to copy ssh keys to VS Code dev containers.

    The https address can be found under Clone button on the page you should see after creating your repo on Gitlab as shown in this image

    Gitlab Project Creation Page 2 : VS Code Dev Containers and Git
    Gitlab Project Creation Page 2 : VS Code Dev Containers and Git
    1. Now, commit and push the code
    git add .
    git commit -m "Initial commit"
    git push --set-upstream origin main

    Once, you have the repo setup this way, you are all set to code from VS Code dev containers, happy coding!

    References:

    1. https://code.visualstudio.com/remote/advancedcontainers/sharing-git-credentials
    2. https://code.visualstudio.com/docs/devcontainers/tutorial
    3. https://code.visualstudio.com/docs/devcontainers/containers
  • How to Generate Python Code from Protobuf

    Protocol Buffers, which are protobuf for short, is much compact than XML and JSON and hence a great choice for designing efficient inter-service communication. In this post we will see how to generate Python code from protobuf code.

    An example protobuf for product recommendation

    syntax = "proto3";
    
    enum ProductCategory {
        DAIRY = 0;
        VEGETABLES = 1;
        PROCESSED_FOOD = 2;
    }
    
    message ProductRecommendationRequest {
        int32 user_id = 1;
        ProductCategory category = 2;
        int32 max_results = 3;
    }
    
    message ProductRecommendation {
        int32 id = 1;
        string name = 2;
    }
    
    message ProductRecommendationResponse {
        repeated ProductRecommendation recommendations = 1;
    }
    
    service Recommendations {
        rpc Recommend (ProductRecommendationRequest) returns (ProductRecommendationResponse);
    }

    Getting grpcio-tools library

    pip install grpcio-tools

    Generating Python code from protobuf

    python -m grpc_tools.protoc -I . --python_out=. --grpc_python_out=. products.proto

    Output

    This generates several Python files from the .proto file. Here’s a breakdown:

    • python -m grpc_tools.protoc invokes the protobuf compiler, which will generate Python code from the protobuf code.
    • -I . tells the compiler to look into current directory to find imported protobuf files. We are not importing any files but this option is needed still.
    • --python_out=. --grpc_python_out=. this options tells the compiler where to output the Python files. It will generate two files, and you could put each in a separate directory with these options if you wanted to.
    • products.proto is the path to the protobuf file

    Please let us know your questions in the comments below.

  • FastAPI Application Performance Monitoring with SigNoz

    What is SigNoz?

    SigNoz stands as an open-source alternative to Datadog or New Relic. It serves as a comprehensive solution for all your observability requirements, encompassing Application Performance Monitoring (APM), logs, metrics, exceptions, alerts, and dashboards, all enhanced by a robust query builder.

    Here is a quick guide to get up and running with FastAPI instrumentation with SigNoz really fast.

    Getting SigNoz

    I prefer using docker compose

    git clone -b main https://github.com/SigNoz/signoz.git && cd signoz/deploy/
    docker compose -f docker/clickhouse-setup/docker-compose.yaml up -d

    Testing SigNoz Installation

    http://localhost:3301

    If all went well, you should see a webpage asking you to create an account (yeah, that is correct)

    Getting test FastAPI App

    Here is a sample FastAPI app with basic instrumentation. I will use the same for this example.

    git clone https://github.com/SigNoz/sample-fastAPI-app.git
    cd sample-fastAPI-app
    docker build -t sample-fastapi-app .
    docker run -d --name fastapi-container \ 
    --net clickhouse-setup_default  \ 
    --link clickhouse-setup_otel-collector_1 \
    -e OTEL_METRICS_EXPORTER='none' \
    -e OTEL_RESOURCE_ATTRIBUTES='service.name=fastapiApp' \
    -e OTEL_EXPORTER_OTLP_ENDPOINT='http://clickhouse-setup_otel-collector_1:4317' \
    -e OTEL_EXPORTER_OTLP_PROTOCOL=grpc \
    -p 5002:5002 sample-fastapi-app

    Generate Traffic Using Locust

    pip install locust
    locust -f locust.py --headless --users 10 --spawn-rate 1 -H http://localhost:5002:5002

    Done!

    Open-source application performance monitoring tools should offer cost efficiency, customization, and transparency. They provide community support, vendor independence, and continuous improvement through collaborative innovation. SigNoz is already very popular with the open-source community, let’s see how does it change the APM landscape.

  • Application Log Processing and Visualization with Grafana and Prometheus

    Understanding the Components:

    • Prometheus: Prometheus is an open-source monitoring and alerting toolkit designed for reliability and scalability. It excels at collecting time-series data, making it a perfect fit for monitoring dynamic systems like applications. Prometheus operates on a pull-based model, regularly scraping metrics endpoints exposed by various services.
    • Grafana: Grafana is a popular open-source platform for monitoring and observability. It provides a highly customizable and interactive dashboard that can pull data from various sources, including Prometheus. Grafana enables users to create visually appealing dashboards to represent data and metrics in real-time.

    1. Setting Up Prometheus:

    • Installation:
      # Example using Docker
      docker run -p 9090:9090 -v /path/to/prometheus.yml:/etc/prometheus/prometheus.yml prom/prometheus
    • Configuration (prometheus.yml):
      global:
        scrape_interval: 15s
    
      scrape_configs:
        - job_name: 'my-app'
          static_configs:
            - targets: ['localhost:5000'] # Replace with your application's address

    2. Instrumenting Your Application:

    • Add Prometheus Dependency:
      <!-- Maven Dependency for Java applications -->
      <dependency>
        <groupId>io.prometheus</groupId>
        <artifactId>simpleclient</artifactId>
        <version>0.10.0</version>
      </dependency>
    • Instrumenting Code:
      import io.prometheus.client.Counter;
    
      public class MyAppMetrics {
          static final Counter requests = Counter.build()
              .name("my_app_http_requests_total")
              .help("Total HTTP Requests")
              .register();
    
          public static void main(String[] args) {
              // Your application code here
              requests.inc();
          }
      }

    3. Configuring Grafana:

    • Installation:
      # Example using Docker
      docker run -p 3000:3000 grafana/grafana
    • Configuration:
      • Access Grafana at http://localhost:3000.
      • Login with default credentials (admin/admin).
      • Add Prometheus as a data source.

    4. Building Dashboards in Grafana:

    • Create a Dashboard:
      • Click on “+” -> Dashboard.
      • Add a panel, choose Prometheus data source, and use PromQL queries.
    • Example PromQL Queries:
      # HTTP Requests over time
      my_app_http_requests_total
    
      # Error Rate
      sum(rate(my_app_http_requests_total{status="error"}[5m])) / sum(rate(my_app_http_requests_total[5m]))
    
      # Custom Business Metric
      my_app_custom_metric

    5. Alerting in Grafana:

    • Set up Alerts:
      • In the dashboard, click on “Settings” -> “Alert” tab.
      • Define conditions and notification channels for alerting.

    6. Scaling and Extending:

    • Horizontal Scaling:
      • Deploy multiple Prometheus instances for high availability.
      • Use a load balancer to distribute traffic.
    • Grafana Plugins:
      • Explore and install plugins for additional data sources and visualization options.

    7. Best Practices:

    • Logging Best Practices:
      • Ensure logs include relevant information for metrics.
      • Follow consistent log formats.
    • Security:
      • Secure Prometheus and Grafana instances.
      • Use authentication and authorization mechanisms.

    8. Conclusion:

    Integrating Prometheus and Grafana provides a powerful solution for application log processing and visualization. By following this technical guide, you can establish a robust monitoring and observability pipeline, allowing you to gain deep insights into your application’s performance and respond proactively to issues. Adjust configurations based on your application’s needs and continuously optimize for a seamless monitoring experience.

  • Understanding Rule-Based Systems in the Context of Software Design

    Introduction:

    Rule-based systems, a cornerstone in the field of artificial intelligence and software engineering, play a pivotal role in automating decision-making processes. These systems leverage a set of predefined rules to interpret data, make informed decisions, and execute actions accordingly. This article explores the intricacies of rule-based systems, their components, and their applications in various domains.

    Components of Rule-Based Systems:

    1. Knowledge Base:
      At the core of a rule-based system lies the knowledge base. This is a repository of rules, facts, and heuristics that the system references when making decisions. The rules are typically expressed in a formal language that the system can interpret. This knowledge base is dynamic, allowing for updates and modifications to accommodate changes in requirements or environmental conditions.
    2. Inference Engine:
      The inference engine is responsible for applying the rules from the knowledge base to the input data. It uses logical reasoning to deduce conclusions and make decisions. Depending on the complexity of the rules, the inference engine may employ various algorithms such as forward chaining, backward chaining, or a combination of both.
    3. Working Memory:
      Working memory serves as the temporary storage for the current state of the system. It holds the data that the inference engine utilizes during the decision-making process. As the system processes information and executes actions, the working memory is updated dynamically.

    How Rule-Based Systems Work:

    1. Rule Evaluation:
      The inference engine evaluates rules based on the conditions specified. Conditions are generally expressed in the form of “if-then” statements. For example, “if the temperature is above 30 degrees Celsius, then turn on the air conditioning.”
    2. Pattern Matching:
      Many rule-based systems employ pattern matching to compare input data against the conditions specified in the rules. This involves identifying patterns or relationships within the data that match the criteria set by the rules.
    3. Conflict Resolution:
      In situations where multiple rules could be applicable, conflict resolution mechanisms come into play. These mechanisms prioritize rules based on predefined criteria, ensuring a systematic approach to decision-making.

    Applications of Rule-Based Systems:

    1. Expert Systems:
      Rule-based systems are widely used in expert systems, where they emulate the decision-making capabilities of human experts in a specific domain. These systems find applications in medical diagnosis, financial analysis, and troubleshooting.
    2. Business Rules Engines:
      In business applications, rule-based systems are employed to define and manage business rules. This ensures consistency and compliance with regulations, automating decision-making processes in areas such as loan approvals, fraud detection, and customer relationship management.
    3. Control Systems:
      Rule-based systems play a crucial role in control systems, automating processes in industrial settings. They are utilized in scenarios where real-time decisions and actions are required based on sensor data and environmental conditions.

    Challenges and Considerations:

    1. Scalability:
      As the knowledge base grows, managing and updating rules can become challenging. Scalability is a crucial consideration to ensure the efficient functioning of large rule-based systems.
    2. Interpretability:
      The interpretability of rule-based systems is essential, particularly in critical applications. Understanding how and why a specific decision was made is crucial for gaining trust in the system.
    3. Maintenance:
      Regular maintenance is required to update rules, accommodate changes in requirements, and ensure the system’s relevance over time. A well-defined maintenance strategy is vital for the long-term success of rule-based systems.

    Conclusion:

    Rule-based systems provide a robust framework for automating decision-making processes across various domains. Their versatility, interpretability, and adaptability make them a valuable tool in the toolkit of software designers and artificial intelligence practitioners. As technology continues to advance, rule-based systems will likely evolve to address new challenges and contribute to the development of intelligent and efficient systems.

  • Introduction to OpenAPI Specifications

    In the ever-evolving landscape of software development, seamless communication between different services and applications is paramount. This is where OpenAPI specifications come into play, serving as a standardized way to describe RESTful APIs. OpenAPI, formerly known as Swagger, provides a set of rules to design and document APIs, ensuring clarity and interoperability among developers, services, and tools.

    Understanding OpenAPI

    OpenAPI is a specification for building APIs that fosters machine-readable documentation. It utilizes a JSON or YAML format to define the structure of an API, including endpoints, request/response formats, and authentication mechanisms. This formalized documentation not only enhances communication among development teams but also facilitates automated processes like code generation and testing.

    Need for OpenAPI Specifications

    1. Standardization and Consistency: OpenAPI brings a level of standardization to API design, making it easier for developers to understand, consume, and integrate with APIs across different projects. Consistency in API design reduces the learning curve for developers, fostering a more efficient and collaborative development process.

    2. Documentation as a First-Class Citizen: Comprehensive and accurate documentation is a cornerstone of successful API development. OpenAPI puts documentation at the forefront, allowing developers to generate human-readable documentation directly from the API specification. This not only saves time but also ensures that the documentation is always in sync with the actual API implementation.

    3. Code Generation: OpenAPI enables automatic code generation, translating API specifications into client libraries, server stubs, and API documentation. This automation accelerates development cycles, reduces manual errors, and ensures that clients using the API adhere to the expected contract. This feature is particularly valuable in polyglot environments where services are implemented in different programming languages.

    4. API Testing: With a well-defined OpenAPI specification, developers can easily create automated tests that validate whether an API implementation complies with the expected behavior. This ensures the reliability and stability of APIs, especially in large and complex systems where changes in one component can impact others.

    5. Tooling Ecosystem: The adoption of OpenAPI has given rise to a rich ecosystem of tools that support various stages of the API development lifecycle. From editors for creating and editing specifications to validators that ensure compliance, the OpenAPI ecosystem enhances the overall development experience.

    6. Interoperability: OpenAPI promotes interoperability by providing a common ground for expressing API contracts. This enables seamless integration between different systems, fostering a more collaborative and interconnected software ecosystem.

    In conclusion, OpenAPI specifications play a pivotal role in modern API development by providing a standardized, machine-readable way to describe APIs. The benefits of adopting OpenAPI extend from enhanced documentation to improved consistency, automation, and interoperability. As the software development landscape continues to evolve, OpenAPI remains a crucial tool for building robust and interoperable APIs.

  • Gunicorn: FastAPI in Production

    1. Gunicorn Configuration

    Gunicorn is a widely used WSGI server for running Python web applications. When deploying FastAPI, Gunicorn is often used in conjunction with Uvicorn to provide a production-ready server.

    Install Gunicorn using:

    pip install gunicorn

    Run Gunicorn with Uvicorn workers:

    gunicorn -k uvicorn.workers.UvicornWorker your_app:app -w 4 -b 0.0.0.0:8000

    Here:

    • -k uvicorn.workers.UvicornWorker specifies the worker class.
    • your_app:app points to your FastAPI application instance.
    • -w 4 sets the number of worker processes. Adjust this based on the available resources and expected load.

    2. Worker Processes

    The -w flag in the Gunicorn command determines the number of worker processes. The optimal number depends on factors like CPU cores, available memory, and the nature of your application.

    For example, on a machine with four CPU cores:

    gunicorn -k uvicorn.workers.UvicornWorker your_app:app -w 4 -b 0.0.0.0:8000

    If your application performs a significant amount of asynchronous I/O operations, you might increase the number of workers. However, keep in mind that too many workers can lead to resource contention.

    3. Load Balancing and Scaling

    In a production setting, deploying multiple instances of your FastAPI application and distributing incoming requests across them is essential for scalability and fault tolerance. The number of worker processes can impact the optimal scaling strategy.

    Consider using tools like nginx for load balancing or deploying your application in a container orchestration system like Kubernetes.

    4. Graceful Shutdown

    Ensure that Gunicorn handles signals gracefully. FastAPI applications may have asynchronous tasks or background jobs that need to complete before shutting down. Gunicorn’s --graceful-timeout option can be set to allow for graceful termination.

    gunicorn -k uvicorn.workers.UvicornWorker your_app:app -w 4 -b 0.0.0.0:8000 --graceful-timeout 60

    This allows Gunicorn to wait up to 60 seconds for workers to finish processing before shutting down.

    In conclusion, the choice of Gunicorn and worker processes is a crucial aspect of deploying FastAPI applications in a production environment. Fine-tuning the number of workers and configuring Gunicorn parameters according to your application’s characteristics and deployment environment ensures optimal performance and scalability.

  • Understanding Data Serialization in Apache Kafka

    Introduction:
    Apache Kafka is a distributed streaming platform that has gained widespread adoption for its ability to handle real-time data feeds and provide fault-tolerant, scalable, and durable data storage. Central to Kafka’s functionality is the concept of data serialization, which is the process of converting data structures or objects into a format that can be easily transmitted over the Kafka cluster. In this article, we will explore the significance of data serialization in Kafka and how it contributes to the platform’s efficiency and flexibility.

    Why Data Serialization Matters in Kafka:
    Kafka operates by exchanging messages or records between producers and consumers. These messages can contain a variety of data types and structures, ranging from simple strings to complex objects. For efficient transmission and storage, Kafka relies on serialization to convert these diverse data types into a common format.

    The Challenges of Heterogeneous Data:
    In a Kafka ecosystem, producers and consumers may be implemented in different programming languages, and the data they exchange can have various structures. Data serialization addresses the challenge of heterogeneity by providing a standardized way to represent data that is language-agnostic. This ensures that data produced by a Java application, for example, can be seamlessly consumed by a consumer written in Python or any other supported language.

    Avro and Apache Kafka:
    One of the popular choices for data serialization in Kafka is Apache Avro. Avro’s schema-based approach is well-suited for Kafka’s distributed and fault-tolerant nature. The schema is defined in JSON format, providing a clear structure for the data being transmitted. Avro’s compact binary format is particularly advantageous in Kafka environments, as it reduces the amount of data transmitted over the network and stored in Kafka topics.

    Schema Evolution and Compatibility:
    Kafka supports schema evolution, allowing for the modification of the data schema over time without disrupting existing producers or consumers. Avro’s dynamic typing and built-in support for schema evolution make it a natural fit for Kafka. When a schema evolves, both producers and consumers can continue to operate seamlessly, accommodating changes in data structures without requiring simultaneous updates.

    Choosing the Right Serialization Format:
    While Avro is a popular choice, Kafka supports other serialization formats such as JSON, Protocol Buffers, and more. The choice of serialization format depends on factors like performance requirements, schema complexity, and the need for schema evolution. For instance, Avro may be preferred for its compactness and schema evolution capabilities, while JSON might be chosen for its human-readable format.

    Integration with Kafka Producers and Consumers:
    Kafka producers and consumers need to be configured to use the same serialization format to ensure compatibility. Producers serialize data before sending it to Kafka topics, and consumers deserialize data when retrieving messages. Both sides must agree on the serialization format and, if applicable, the schema registry, which manages and stores Avro schemas for versioning and compatibility.

    Conclusion:
    In the realm of distributed streaming and messaging systems, effective data serialization is a cornerstone for ensuring the seamless and efficient exchange of data. Apache Kafka’s support for various serialization formats, with a notable mention to Avro, empowers organizations to build robust, scalable, and future-proof data pipelines. By understanding the significance of data serialization in Kafka, developers and architects can make informed choices to optimize their Kafka implementations for performance, flexibility, and maintainability.

  • Leveraging Dapr in Microservices Design

    Microservices architecture has gained prominence for its ability to enhance scalability, maintainability, and flexibility in application development. In this context, Distributed Application Runtime, or Dapr, emerges as a powerful toolkit that simplifies the development of microservices, addressing common challenges associated with distributed systems. This article explores the integration of Dapr in microservices design, outlining its key features and benefits.

    What is Dapr?

    Dapr is an open-source, portable runtime that allows developers to build microservices-based applications without being tied to specific languages or frameworks. It provides a set of building blocks that streamline the development of distributed systems, enabling developers to focus on business logic rather than dealing with the complexities of distributed architectures.

    Dapr: Key Features

    1. Service Invocation:
      • Dapr facilitates service-to-service communication through a simple and consistent API, abstracting away the intricacies of underlying protocols. This simplifies the creation of resilient and loosely-coupled microservices.
    2. State Management:
      • Dapr offers a state management building block, enabling microservices to maintain state without direct coupling to a specific database. This abstraction simplifies data storage and retrieval, enhancing scalability and fault tolerance.
    3. Publish-Subscribe Messaging:
      • Event-driven architectures are pivotal in microservices. Dapr supports the publish-subscribe pattern, allowing microservices to communicate asynchronously through events. This promotes a decoupled and responsive system.
    4. Secret Management:
      • Handling sensitive information such as API keys and connection strings is a critical aspect of microservices security. Dapr provides a secure and straightforward way to manage secrets, reducing the risk of exposure.
    5. Observability:
      • Monitoring and debugging distributed systems can be challenging. Dapr includes observability features that simplify tracking and logging, providing developers with valuable insights into the behavior of their microservices.
    6. Bindings:
      • Dapr introduces the concept of bindings, which simplifies integration with external services and systems. Whether it’s connecting to a message queue or a database, bindings streamline the process, enhancing interoperability.

    Why User Dapr with Microservices?

    1. Technology Agnosticism:
      • Dapr supports a wide range of programming languages and frameworks, allowing developers to choose the tools that best fit their needs. This technology agnosticism fosters flexibility and avoids vendor lock-in.
    2. Simplified Development:
      • With Dapr handling common distributed system concerns, developers can focus on writing business logic rather than dealing with the intricacies of microservices communication, state management, and event handling.
    3. Consistent Abstractions:
      • Dapr provides consistent abstractions for various microservices-related tasks. This consistency simplifies the learning curve for developers and promotes best practices across the development team.
    4. Improved Resilience:
      • Dapr’s features, such as retries and circuit breakers, enhance the resilience of microservices. This is crucial in distributed systems where failures are inevitable, ensuring that the overall application remains robust.
    5. Scalability:
      • Dapr’s state management and publish-subscribe messaging contribute to the scalability of microservices. Services can scale independently without introducing unnecessary complexity into the system.

    Dapr emerges as a compelling toolkit for microservices design, providing a set of abstractions and features that simplify the complexities of distributed systems. Its technology-agnostic approach, coupled with consistent abstractions and resilience features, makes it an invaluable asset for developers navigating the intricacies of microservices architecture. By integrating Dapr into microservices design, developers can enhance scalability, maintainability, and overall system robustness, ushering in a new era of streamlined distributed application development.

  • Microservices Design Principles

    Microservices architecture has become a cornerstone in modern software development, revolutionizing the way applications are designed, developed, and maintained. This article delves into the intricate technical aspects of microservices design principles, elucidating the key considerations that architects and developers must bear in mind when crafting resilient, scalable, and maintainable microservices-based systems.

    Service Independence

    At the core of microservices architecture lies the fundamental principle of service independence. Each microservice encapsulates a specific business capability and operates as a standalone entity. This autonomy enables independent development, deployment, and scaling, facilitating agility and responsiveness to evolving business requirements.

    API-First Approach

    Microservices communicate with each other through well-defined APIs, adhering to an API-first approach. Rigorous API specifications, often using RESTful protocols or lightweight messaging systems, establish clear boundaries between services. This approach fosters interoperability, allowing services to evolve independently while maintaining compatibility.

    Decentralized Data Management

    In the realm of microservices, each service manages its own data, adhering to the principle of decentralized data management. This ensures that services are not tightly coupled to a shared database, mitigating data consistency challenges and promoting autonomy. Asynchronous event-driven architectures are often employed to propagate data changes across services.

    Containerization and Orchestration

    Containerization, exemplified by technologies like Docker, plays a pivotal role in microservices design. Containers encapsulate services and their dependencies, fostering consistency across diverse environments. Orchestration tools such as Kubernetes provide automated deployment, scaling, and management of containerized microservices, streamlining operations at scale.

    Fault Tolerance and Resilience

    Microservices must be resilient to faults and failures inherent in distributed systems. Implementing robust fault-tolerant mechanisms, including retries, circuit breakers, and fallback strategies, is imperative. Service degradation and graceful handling of failures ensure the overall stability of the system, even in adverse conditions.

    Continuous Integration and Continuous Deployment (CI/CD)

    Automation is the bedrock of microservices development, and CI/CD pipelines are its manifestation. Adopting CI/CD practices enables rapid and reliable delivery of microservices, automating testing, integration, and deployment processes. This automation is indispensable for maintaining the velocity required in dynamic and scalable microservices ecosystems.

    Monitoring and Logging

    Effective monitoring and logging are indispensable components of microservices architecture. Tools such as Prometheus and Grafana provide real-time insights into service health, performance, and resource utilization. The ELK stack (Elasticsearch, Logstash, Kibana) aids in centralized logging, enabling comprehensive analysis and troubleshooting.

    Security by Design

    Security considerations are paramount in microservices design. Each service should incorporate its own security mechanisms, including secure communication protocols (e.g., HTTPS), authentication, and authorization. API gateways serve as a protective layer, ensuring controlled access and security enforcement across services.

    Organizational Impact

    Microservices architecture extends beyond technical aspects, necessitating a paradigm shift in organizational structure. Teams are organized around business capabilities rather than traditional technical layers, fostering cross-functional collaboration and agility. This restructuring aligns with the autonomous nature of microservices.

    Comprehensive Testing Strategies

    Testing microservices demands a comprehensive strategy encompassing unit tests, integration tests, and end-to-end tests. Service virtualization and containerized testing environments are indispensable for isolating and validating individual microservices. Rigorous testing ensures the reliability and correctness of microservices in diverse scenarios.

    Conclusion

    In conclusion, the adoption of microservices architecture demands a nuanced understanding of its intricate technical principles. Service independence, API-first design, decentralized data management, containerization, fault tolerance, CI/CD, monitoring, security, organizational restructuring, and comprehensive testing are the pillars upon which successful microservices systems are built. Embracing these principles empowers organizations to navigate the complexities of modern software development, delivering robust, scalable, and agile solutions that meet the demands of today’s dynamic business landscape.